Menu
×
   ❮     
HTML CSS JAVASCRIPT SQL PYTHON JAVA PHP HOW TO W3.CSS C C++ C# BOOTSTRAP REACT MYSQL JQUERY EXCEL XML DJANGO NUMPY PANDAS NODEJS R TYPESCRIPT ANGULAR GIT POSTGRESQL MONGODB ASP AI GO KOTLIN SASS VUE DSA GEN AI SCIPY AWS CYBERSECURITY DATA SCIENCE
     ❯   

JavaScript图形库

图形库

用于人工智能图形和其他图表JavaScript库

  • Plotly.js
  • Chart.js
  • Google Chart

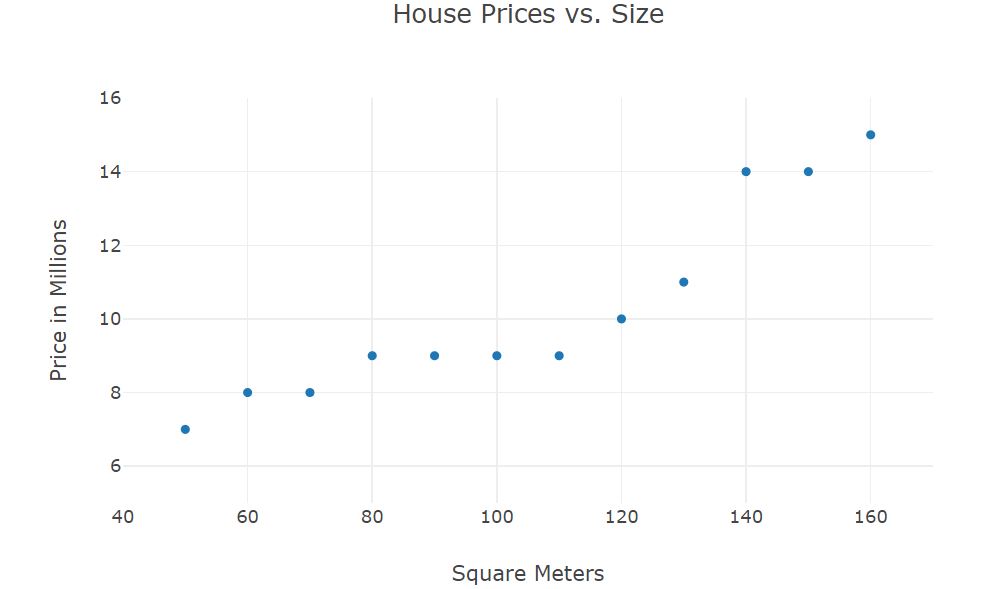
Plotly.js

Plotly.js是一个图表库,它包含超过40种图表类型、3D图表、统计图形和SVG地图。


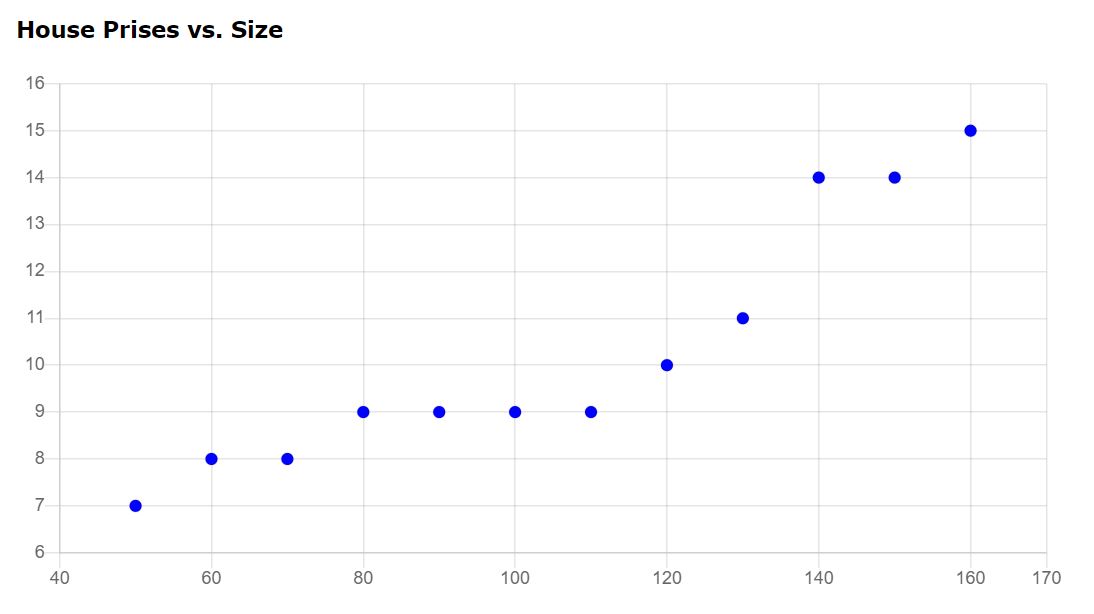
Chart.js Scatter

了解更多...


Chart.js

Chart.js包含许多内置图表类型

  • 散点图
  • 折线图
  • 条形图
  • 雷达图
  • 饼图和环形图
  • 极坐标图
  • 气泡图
Chart.js Scatter

了解更多...


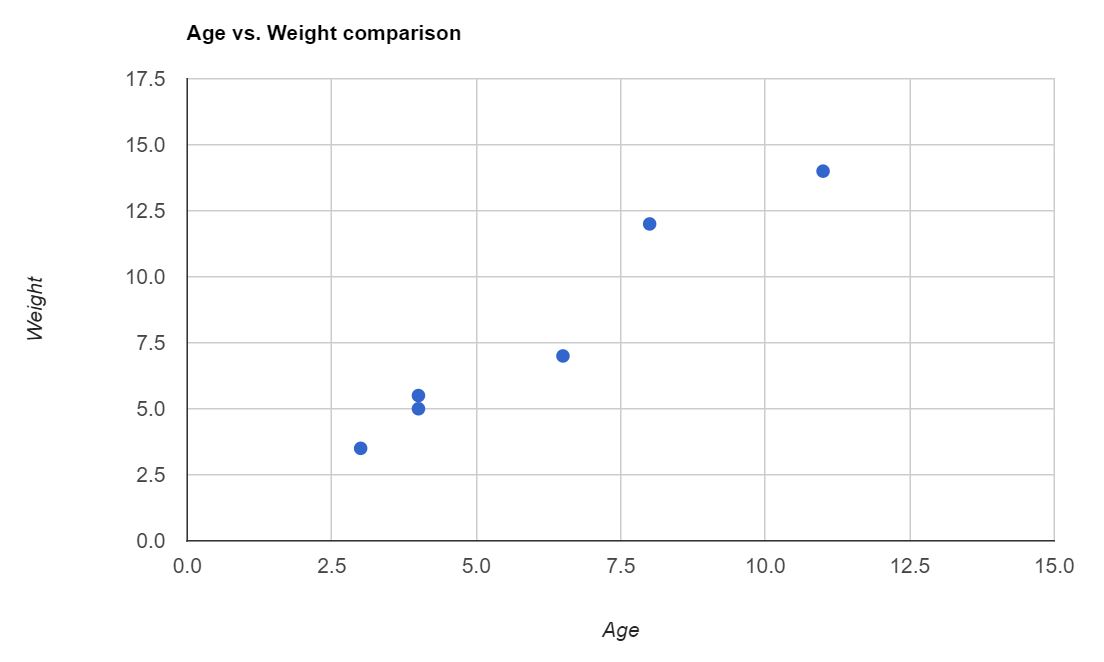
Google Chart

从简单的折线图到复杂的树状图,Google Chart提供了许多内置的图表类型

  • 散点图
  • 折线图
  • 条形/柱形图
  • 面积图
  • 饼图
  • 环形图
  • 组织结构图
  • 地图/地理图表
Google Scatter

了解更多...

×

Contact Sales

If you want to use W3Schools services as an educational institution, team or enterprise, send us an e-mail:
[email protected]

Report Error

If you want to report an error, or if you want to make a suggestion, send us an e-mail:
[email protected]

W3Schools is optimized for learning and training. Examples might be simplified to improve reading and learning. Tutorials, references, and examples are constantly reviewed to avoid errors, but we cannot warrant full correctness of all content. While using W3Schools, you agree to have read and accepted our terms of use, cookie and privacy policy.

Copyright 1999-2024 by Refsnes Data. All Rights Reserved. W3Schools is Powered by W3.CSS.