Seaborn
使用 Seaborn 可视化分布
Seaborn 是一个在底层使用 Matplotlib 绘制图形的库。它将用于可视化随机分布。
安装 Seaborn。
如果你已在系统上安装了 Python 和 PIP,请使用此命令进行安装
C:\Users\Your Name>pip install seaborn
如果你使用 Jupyter,请使用此命令安装 Seaborn
C:\Users\Your Name>!pip install seaborn
Distplots
Distplot 代表分布图,它以数组作为输入,并绘制一个对应于数组中点分布的曲线。
导入 Matplotlib
使用以下语句在你的代码中导入 Matplotlib 模块的 pyplot 对象import matplotlib.pyplot as plt
你可以在我们的 Matplotlib 教程 中了解 Matplotlib 模块。
导入 Seaborn
使用以下语句在你的代码中导入 Seaborn 模块import seaborn as sns
绘制 Distplot
示例
import matplotlib.pyplot as plt
import seaborn as sns
sns.distplot([0, 1, 2, 3, 4, 5])
plt.show()
自己动手试一试 »
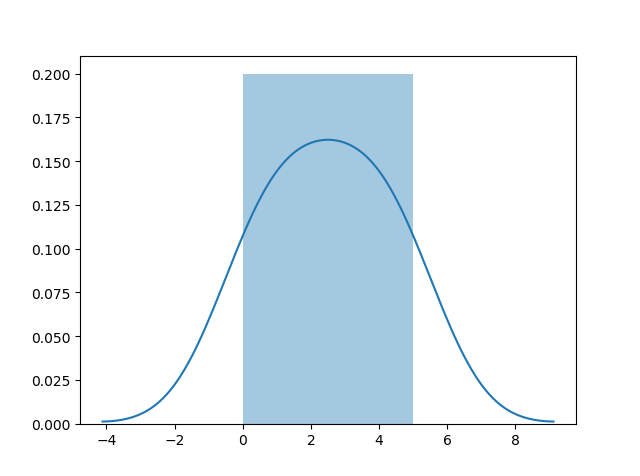
绘制不带直方图的 Distplot
示例
import matplotlib.pyplot as plt
import seaborn as sns
sns.distplot([0, 1, 2, 3, 4, 5], hist=False)
plt.show()
自己动手试一试 »
注意: 在本教程中,我们将使用:sns.distplot(arr, hist=False) 来可视化随机分布。