Menu
×
   ❮     
HTML CSS JAVASCRIPT SQL PYTHON JAVA PHP HOW TO W3.CSS C C++ C# BOOTSTRAP REACT MYSQL JQUERY EXCEL XML DJANGO NUMPY PANDAS NODEJS R TYPESCRIPT ANGULAR GIT POSTGRESQL MONGODB ASP AI GO KOTLIN SASS VUE DSA GEN AI SCIPY AWS CYBERSECURITY DATA SCIENCE
     ❯   

Logistic 分布


Logistic 分布

Logistic 分布用于描述增长。

广泛应用于机器学习中的逻辑回归、神经网络等。

它有三个参数

loc - 均值,峰值所在位置。默认为 0。

scale - 标准差,分布的平坦度。默认为 1。

size - 返回数组的形状。

示例

从均值为 1,标准差为 2.0 的 Logistic 分布中抽取 2x3 个样本。

from numpy import random

x = random.logistic(loc=1, scale=2, size=(2, 3))

print(x)
亲自尝试 »

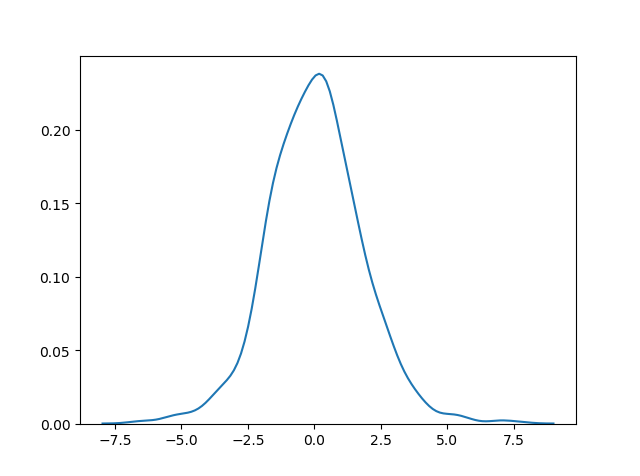
Logistic 分布的可视化

示例

from numpy import random
import matplotlib.pyplot as plt
import seaborn as sns

sns.distplot(random.logistic(size=1000), hist=False)

plt.show()

结果
亲自尝试 »

Logistic 分布和正态分布的区别

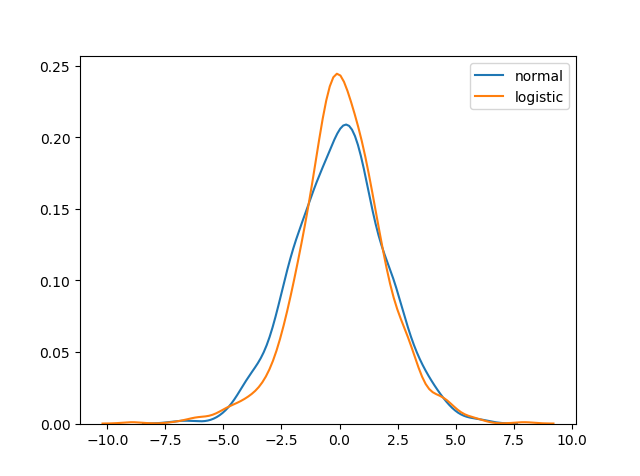
两种分布非常相似,但 Logistic 分布在尾部有更大的面积,这意味着它表示事件在远离均值处发生的可能性更大。

对于较高的 scale 值(标准差),除了峰值外,正态分布和 Logistic 分布非常相似。

示例

from numpy import random
import matplotlib.pyplot as plt
import seaborn as sns

sns.distplot(random.normal(scale=2, size=1000), hist=False, label='normal')
sns.distplot(random.logistic(size=1000), hist=False, label='logistic')

plt.show()

结果
亲自尝试 »


×

Contact Sales

If you want to use W3Schools services as an educational institution, team or enterprise, send us an e-mail:
[email protected]

Report Error

If you want to report an error, or if you want to make a suggestion, send us an e-mail:
[email protected]

W3Schools is optimized for learning and training. Examples might be simplified to improve reading and learning. Tutorials, references, and examples are constantly reviewed to avoid errors, but we cannot warrant full correctness of all content. While using W3Schools, you agree to have read and accepted our terms of use, cookie and privacy policy.

Copyright 1999-2024 by Refsnes Data. All Rights Reserved. W3Schools is Powered by W3.CSS.