数据科学 - 线性回归案例
案例:使用 Duration + Average_Pulse 预测 Calorie_Burnage
创建使用 Average_Pulse 和 Duration 作为解释变量的线性回归表
示例
import pandas as pd
import statsmodels.formula.api as smf
full_health_data = pd.read_csv("data.csv", header=0, sep=",")
model = smf.ols('Calorie_Burnage ~ Average_Pulse + Duration', data = full_health_data)
results = model.fit()
print(results.summary())
自己动手试一试 »
示例解释
- 导入库 statsmodels.formula.api as smf。Statsmodels 是 Python 中的一个统计库。
- 使用 full_health_data 数据集。
- 使用 smf.ols() 基于普通最小二乘法创建模型。请注意,解释变量必须写在括号中的第一个位置。使用 full_health_data 数据集。
- 通过调用 .fit(),您将获得 results 变量。它包含有关回归模型的许多信息。
- 调用 summary() 以获取线性回归结果的表格。
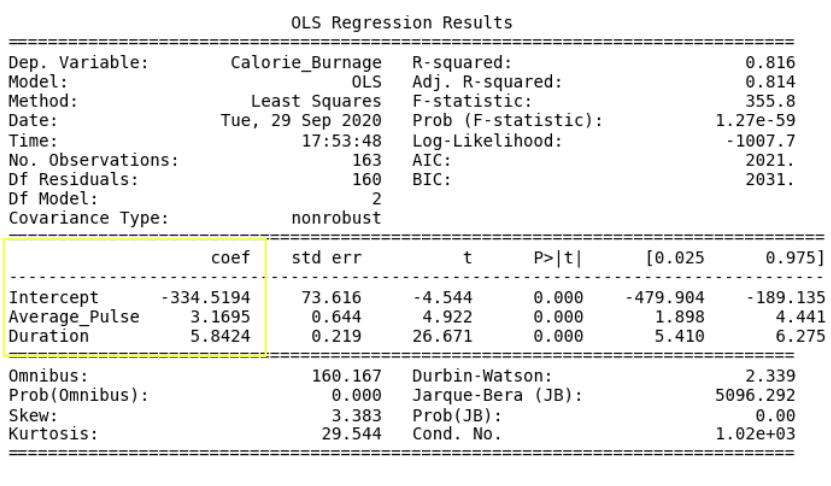
输出

线性回归函数可以用数学方式重写为:
Calorie_Burnage = Average_Pulse * 3.1695 + Duration * 5.8424 - 334.5194
四舍五入到两位小数
Calorie_Burnage = Average_Pulse * 3.17 + Duration * 5.84 - 334.52
在 Python 中定义线性回归函数
在 Python 中定义线性回归函数以执行预测。
如果
- Average pulse 为 110,训练课程时长为 60 分钟,Calorie_Burnage 是多少?
- Average pulse 为 140,训练课程时长为 45 分钟,Calorie_Burnage 是多少?
- Average pulse 为 175,训练课程时长为 20 分钟,Calorie_Burnage 是多少?
示例
def Predict_Calorie_Burnage(Average_Pulse, Duration)
return(3.1695*Average_Pulse + 5.8434 * Duration - 334.5194)
print(Predict_Calorie_Burnage(110,60))
print(Predict_Calorie_Burnage(140,45))
print(Predict_Calorie_Burnage(175,20))
自己动手试一试 »
答案
- Average pulse 为 110,训练课程时长为 60 分钟 = 365 卡路里
- Average pulse 为 140,训练课程时长为 45 分钟 = 372 卡路里
- Average pulse 为 175,训练课程时长为 20 分钟 = 337 卡路里
访问系数
查看系数
- 如果 Average_Pulse 增加一,Calorie_Burnage 增加 3.17。
- 如果 Duration 增加一,Calorie_Burnage 增加 5.84。
访问 P 值
查看每个系数的 P 值。
- Average_Pulse、Duration 和 Intercept 的 P 值为 0.00。
- 由于 P 值小于 0.05,因此所有变量的 P 值在统计上都显著。
因此,我们可以得出结论,Average_Pulse 和 Duration 与 Calorie_Burnage 之间存在关系。
调整 R 平方
如果我们有多个解释变量,R 平方会存在问题。
如果我们添加更多变量,R 平方几乎总会增加,并且永远不会减少。
这是因为我们在线性回归函数周围添加了更多数据点。
如果我们添加与 Calorie_Burnage 无关的随机变量,我们就有可能错误地认为线性回归函数是一个好的拟合。调整 R 平方可以解决这个问题。
因此,如果我们有多个解释变量,最好查看调整后的 R 平方值。
调整后的 R 平方值为 0.814。
R 平方值始终在 0 到 1 之间(0% 到 100%)。
- 较高的 R 平方值表示许多数据点接近线性回归函数线。
- 较低的 R 平方值表示线性回归函数线与数据的拟合度不佳。
结论:模型很好地拟合了数据点!
恭喜!您已完成数据科学库的最后一章。

