Menu
×
   ❮     
HTML CSS JAVASCRIPT SQL PYTHON JAVA PHP HOW TO W3.CSS C C++ C# BOOTSTRAP REACT MYSQL JQUERY EXCEL XML DJANGO NUMPY PANDAS NODEJS R TYPESCRIPT ANGULAR GIT POSTGRESQL MONGODB ASP AI GO KOTLIN SASS VUE DSA GEN AI SCIPY AWS CYBERSECURITY DATA SCIENCE
     ❯   

Pandas - 绘图


绘图

Pandas 使用 plot() 方法创建图表。

我们可以使用 Matplotlib 库的子模块 Pyplot 在屏幕上可视化图表。

在我们的 Matplotlib 教程 中了解更多关于 Matplotlib 的信息。

示例

从 Matplotlib 导入 pyplot 并可视化我们的 DataFrame

import pandas as pd
import matplotlib.pyplot as plt

df = pd.read_csv('data.csv')

df.plot()

plt.show()
自己试试 »

此页面中的示例使用名为“data.csv”的 CSV 文件。

下载 data.csv打开 data.csv


散点图

使用 kind 参数指定您想要散点图

kind = 'scatter'

散点图需要 x 轴和 y 轴。

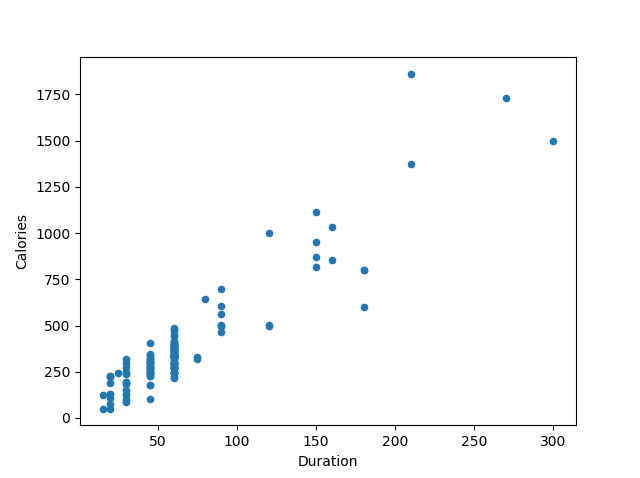
在下面的示例中,我们将使用“Duration”作为 x 轴,“Calories”作为 y 轴。

像这样包含 x 和 y 参数

x = 'Duration', y = 'Calories'

示例

import pandas as pd
import matplotlib.pyplot as plt

df = pd.read_csv('data.csv')

df.plot(kind = 'scatter', x = 'Duration', y = 'Calories')

plt.show()

结果
自己试试 »

请记住:在前面的示例中,我们了解到“Duration”和“Calories”之间的相关性为 0.922721,并且我们得出结论,持续时间越长,燃烧的卡路里越多。

通过查看散点图,我同意。

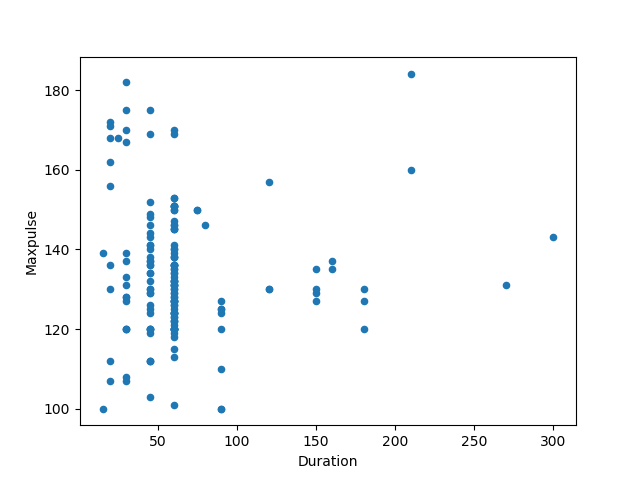
让我们创建另一个散点图,其中列之间存在不良关系,例如“Duration”和“Maxpulse”,相关性为 0.009403

示例

列之间没有关系的散点图

import pandas as pd
import matplotlib.pyplot as plt

df = pd.read_csv('data.csv')

df.plot(kind = 'scatter', x = 'Duration', y = 'Maxpulse')

plt.show()

结果
自己试试 »

w3schools CERTIFIED . 2022

获得认证!

完成 Pandas 模块,进行练习,参加考试,您将获得 w3schools 认证!

10 美元报名

直方图

使用 kind 参数指定您想要直方图

kind = 'hist'

直方图只需要一列。

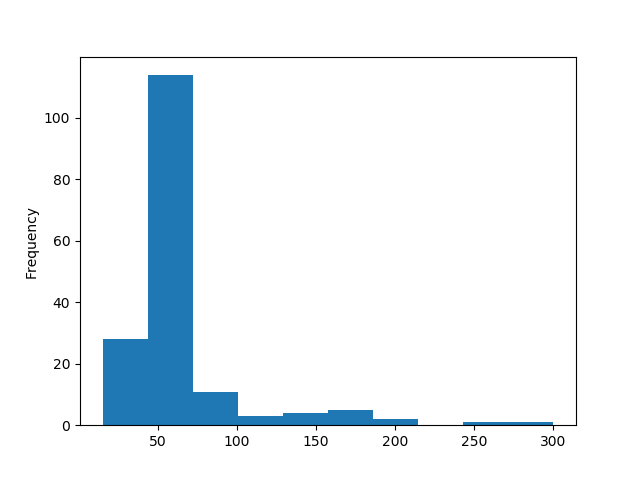
直方图向我们显示每个区间的频率,例如,有多少次锻炼持续了 50 到 60 分钟?

在下面的示例中,我们将使用“Duration”列创建直方图

示例

df["Duration"].plot(kind = 'hist')

结果

自己试试 »

注意:直方图告诉我们,有超过 100 次锻炼持续了 50 到 60 分钟。


×

Contact Sales

If you want to use W3Schools services as an educational institution, team or enterprise, send us an e-mail:
[email protected]

Report Error

If you want to report an error, or if you want to make a suggestion, send us an e-mail:
[email protected]

W3Schools is optimized for learning and training. Examples might be simplified to improve reading and learning. Tutorials, references, and examples are constantly reviewed to avoid errors, but we cannot warrant full correctness of all content. While using W3Schools, you agree to have read and accepted our terms of use, cookie and privacy policy.

Copyright 1999-2024 by Refsnes Data. All Rights Reserved. W3Schools is Powered by W3.CSS.