运行 ❯
建立您
自己的
网站
×
更改方向
更改主题,深色/浅色
前往 Spaces
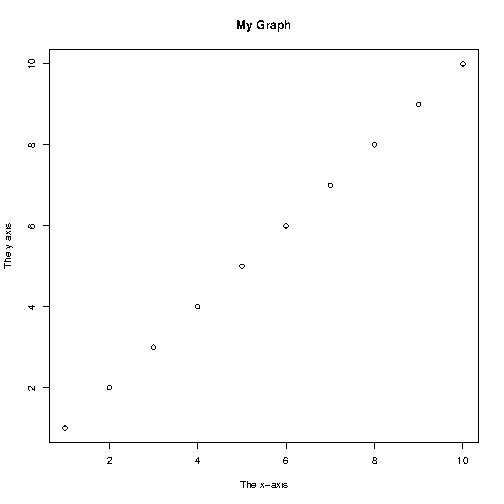
# We need this line of code to show graphs in our compiler bitmap(file="out.png") plot(1:10, main="My Graph", xlab="The x-axis", ylab="The y axis")