运行 ❯
建立您
自己的
网站
×
更改方向
更改主题,深色/浅色
前往 Spaces
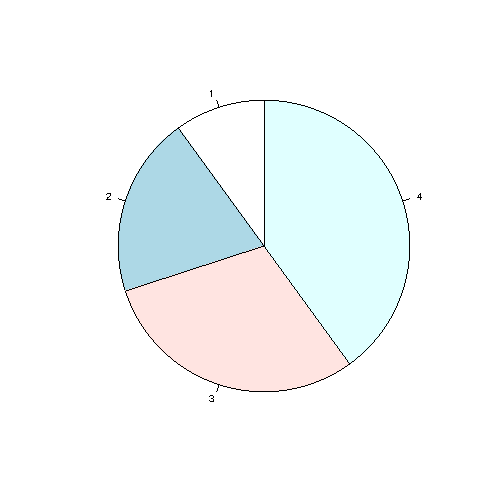
# We need this line of code to show graphs in our compiler bitmap(file="out.png") # Create a vector of pies x <- c(10,20,30,40) # Display the pie chart and start the first pie at 90 degrees pie(x, init.angle = 90)